Romps, Ascending columns, WTG, and convective aggregation, JAS, 2021
Summary
Errata
In equation (A20), the ratio MLqv*/Q was accidentally printed as Q/MLqv*. This has been corrected in the PDF below.
Paper
Description
In 2013, Martin Singh and Paul O'Gorman introduced the zero-buoyancy plume approximation as a way to calculate convective available potential energy (CAPE; the energy available to storms) from first principles for the simplest type of atmosphere (radiative convective equilibrium, RCE; basically, an atmosphere in a box). This was a major advance as it resolved the question of what sets CAPE to first order and explained why CAPE increases with warming. Building on this, an analytic solution for RCE was derived (Romps, 2016); it was shown that the profile of relative humidity is an invariant function of temperature (Romps, 2014); and that result for relative humidity was used to explain why longwave cooling of the troposphere (and, therefore, precipitation) increases at 2% per Kelvin of surface warming (Jeevanjee and Romps, 2018).
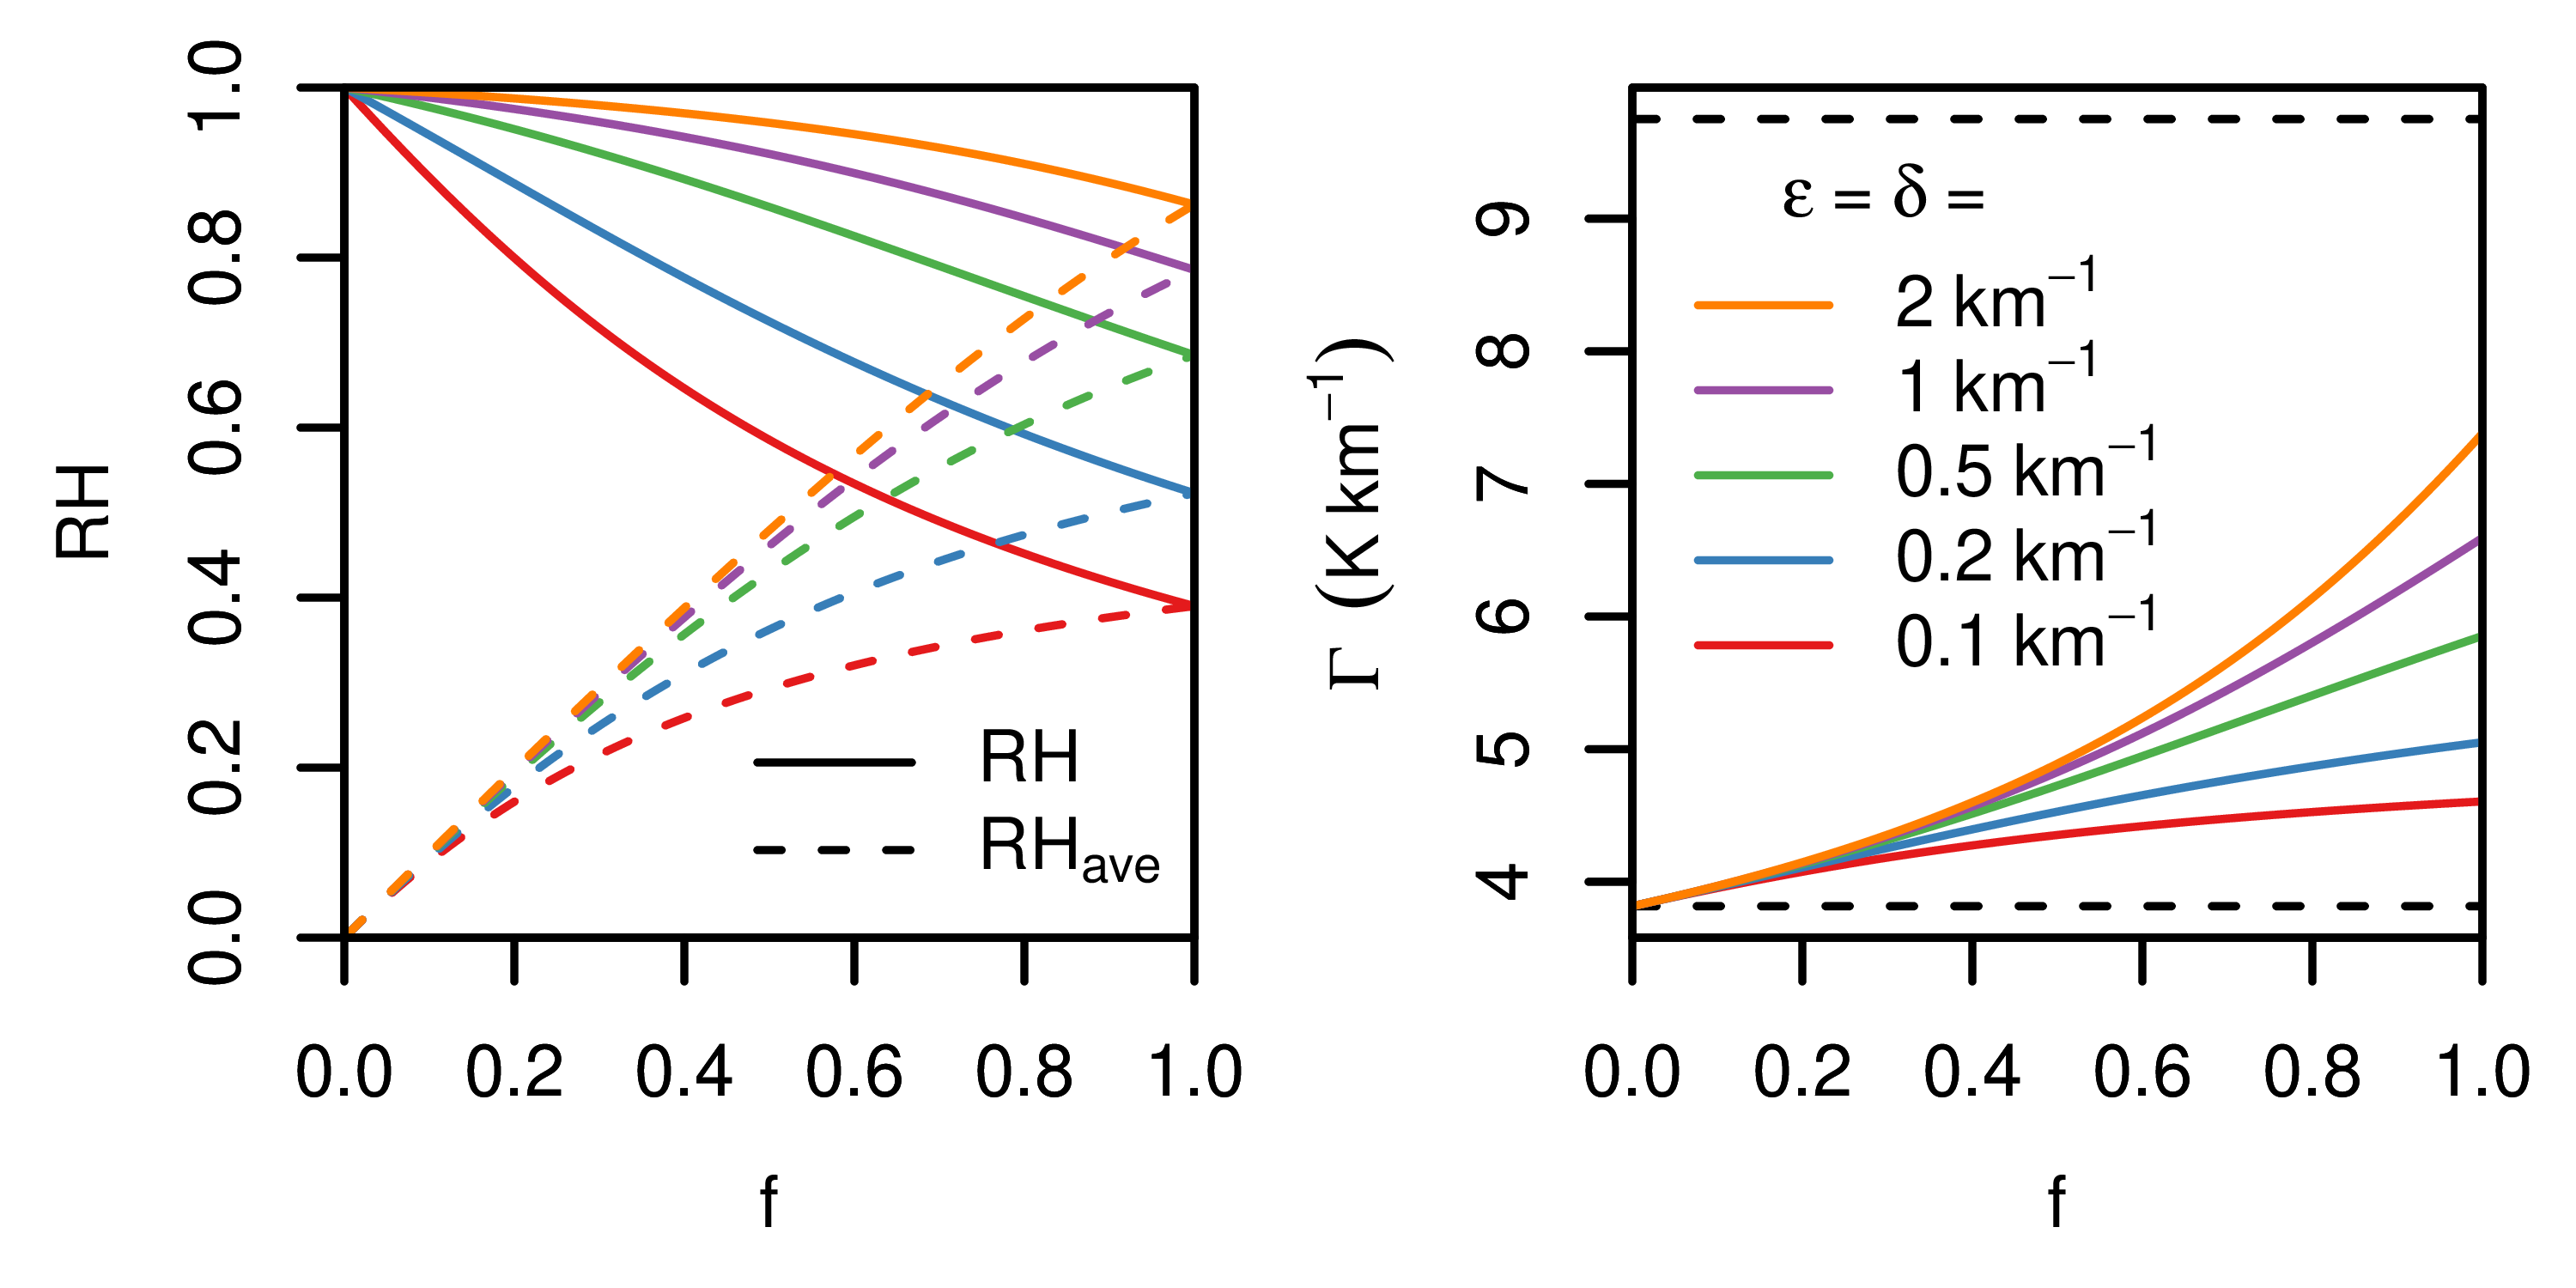
Here, the work of Romps (2014) is extended to produce analytic solutions for the relative humidity, lapse rate, and precipitation rate of an atmosphere with mean ascent. Since the temperature profile of the tropics is set by an average over its ascending, convecting regions, these solutions are useful for understanding the mean lapse rate of the tropics. They also explain why numerical simulations find that convective aggregation (in which the precipitation clumps together in one or more patches) produces higher relative humidity in the convecting patches, lower relative humidity overall, and a smaller lapse rate.
This paper also pushes back on the suggestion by other authors that these types of solutions are useful for understanding the covariability of relative humidity and precipitation in the tropics. It is explained here that such an interpretation assumes that individual patches of the atmosphere can have different lapse rates when, in fact, gravity waves very nearly homogenize the lapse rate throughout the tropics, a fact that is responsible for the observed weak temperature gradient (WTG).
(left) As a function of the fraction f of the domain that is convecting, (solid) RH in the convecting fraction of the domain and (dashed) the domain-mean RH plotted for five different fractional entrainment rates. (right) The lapse rate as a function of f for the five different entrainment rates. The dashed lines mark the dry and moist adiabats.
