Lu and Romps, Predicting fatal heat and humidity using the heat index model, JAP, 2023
Paper
Description
The wet-bulb temperature (Tw) and the heat index (HI) are both commonly used to quantify human heat stress. With regards to the wet-bulb temperature, it is common to use Tw = 35 °C (95 °F) as the survivable limit, but there has been no empirical validation of that threshold. Likewise, with regards to the heat index, the National Weather Service (NWS) uses HI = 125 °F as a threshold for "extreme danger", but there has been no empirical validation of that threshold. In fact, in 2020, a United States administrative judge held that there was no scientific basis to the NWS thresholds and, consequently, overruled fines imposed by the Occupational Safety and Health Administration (OSHA) on that basis. Clearly, we need to figure out which of Tw and HI is the better metric of heat stress and what thresholds to use.
To this end, we used the exquisite experimental data gathered by W. Larry Kenney's PSU HEAT Project. In that project, Kenney's group put participants in a hot climate chamber and slowly increased either the temperature or the humidity, and then they recorded the combination of temperature and humidity that caused the onset of hyperthermia (when the core temperature begins to rise above about 98.6 °F). The standard heat index is not appropriate for this scenario because it assumes a 1.5-m/s wind, whereas the indoor wind speed is only about 0.2 m/s. The wet-bulb temperature can also be shown not to be relevant because it assumes high wind (often generated in practice by swinging a wetted thermometer) and lacks the metabolic heat of a living person. Indeed, we find that there is no single wet-bulb temperature that corresponds to the onset of hyperthermia in the experiments. On the other hand, the heat-index model, modified slightly to account for the indoor wind speed and the measured metabolic rates of the participants, is found to accurately predict the combinations of temperature and humidity that cause hyperthermia. Therefore, with the correct inputs, the heat-index model is a reliable predictor of heat stress.
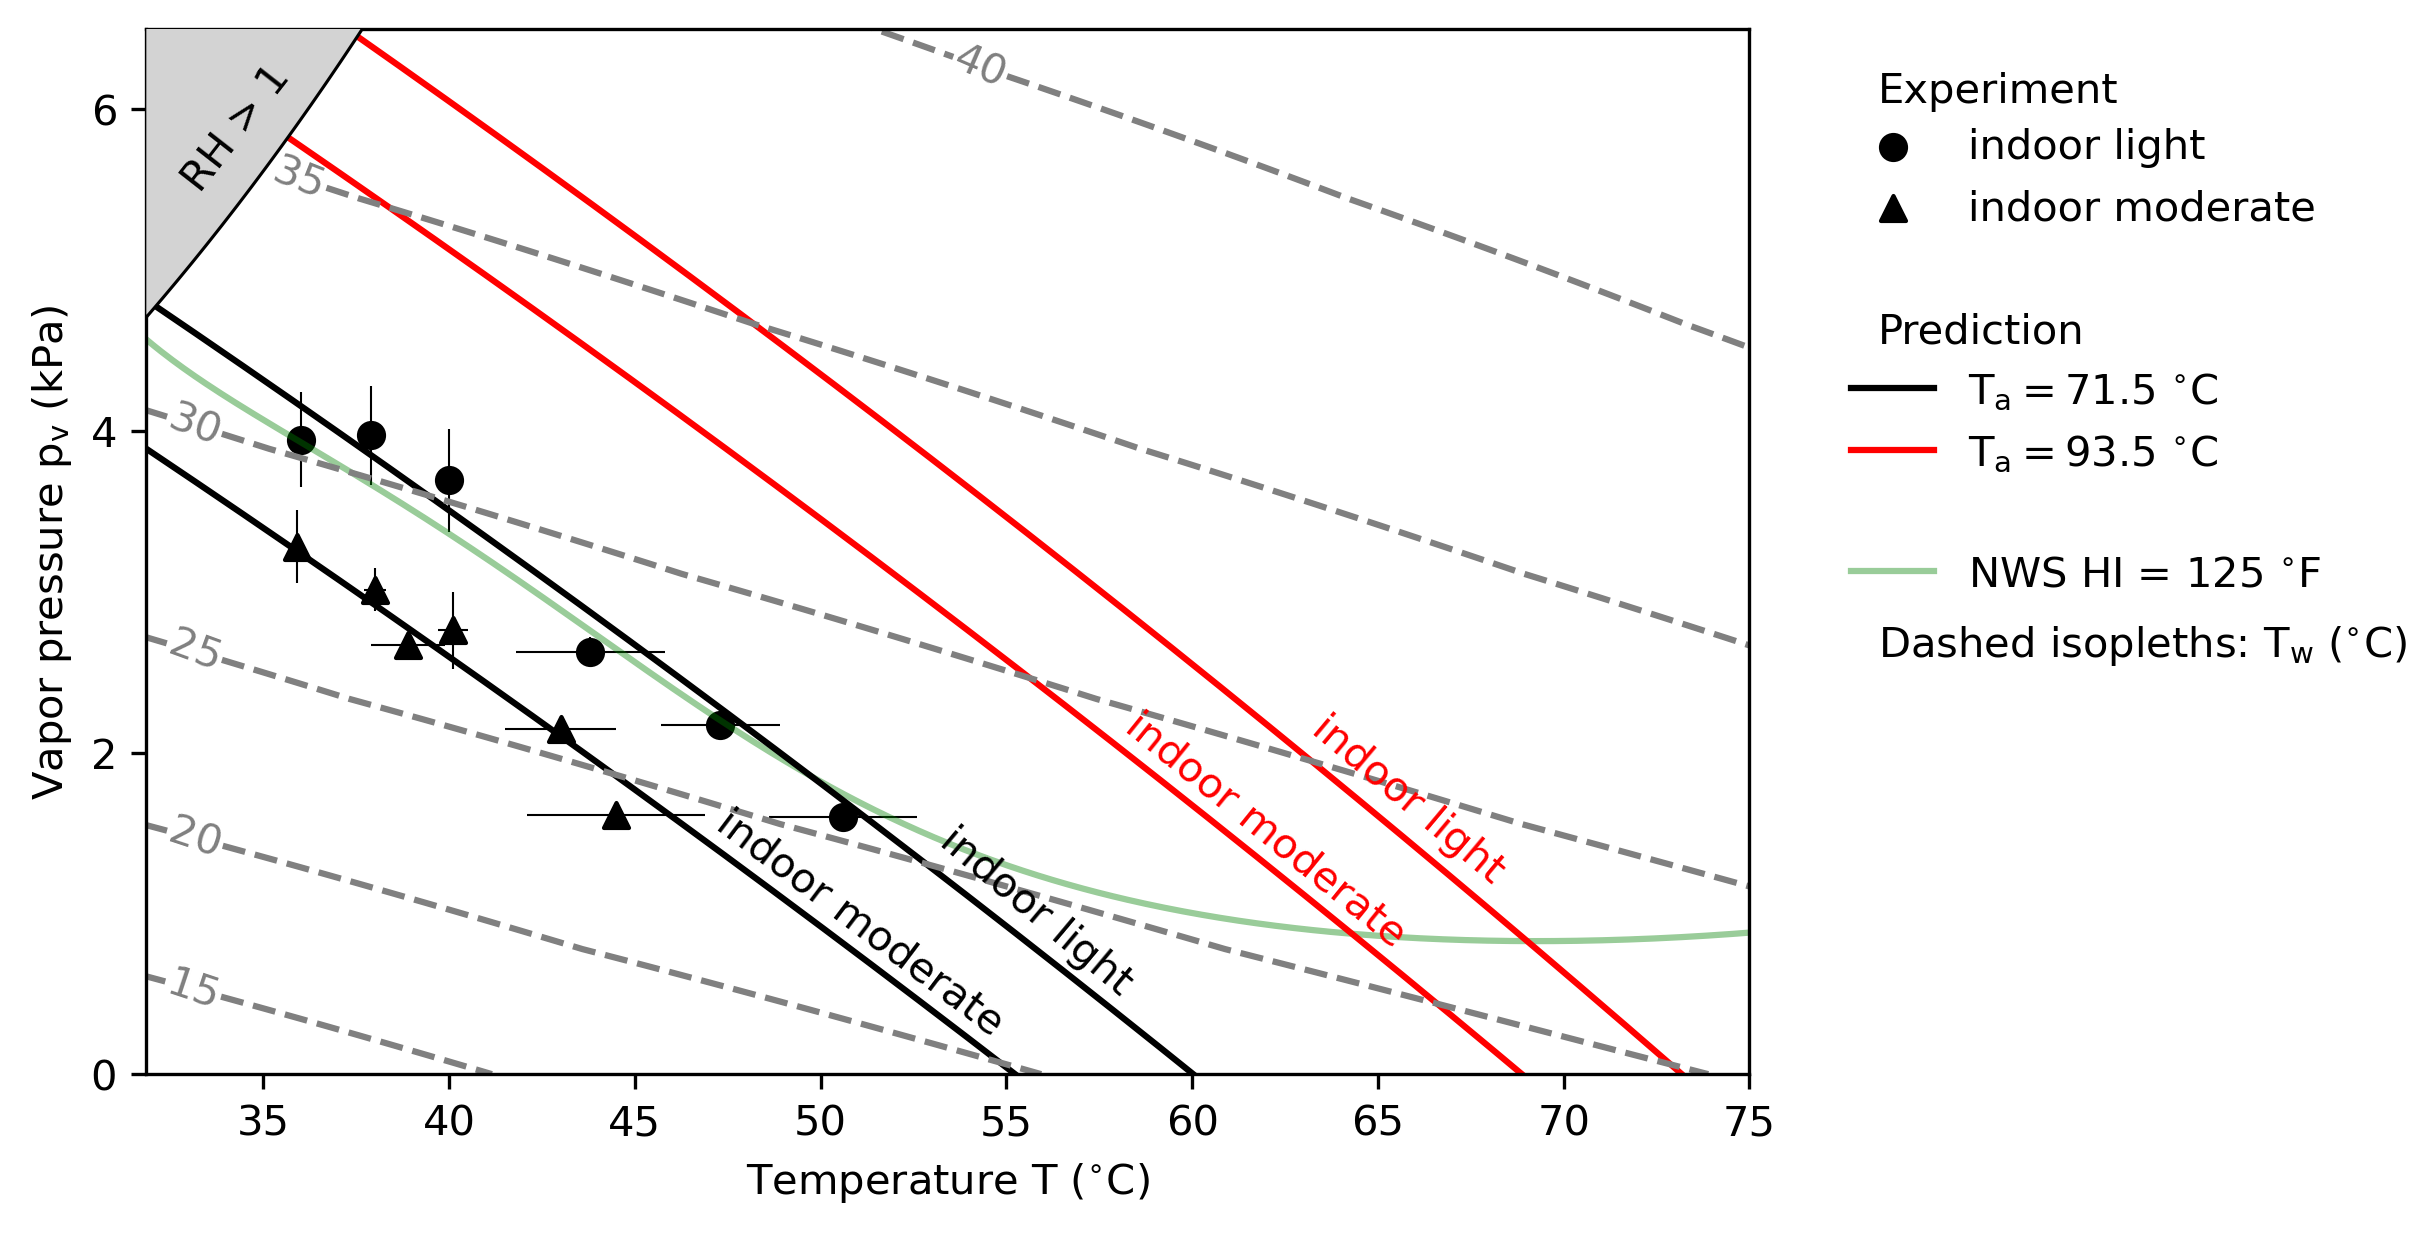
(black symbols) Empirical combinations of temperature and vapor-pressure that cause hyperthermia (the core temperature rising above about 37 °C) with an indoor wind speed. Light exertion is shown with circles and moderate exertion is shown with triangles. Each symbol represents an average of multiple subjects and the error bar represents the standard deviation. (black curves) Constant apparent temperature of 71.5 °C, corresponding to hyperthermia, with the indoor wind speed and light or moderate exertion. (red curves) Same as black curves, but with a constant apparent temperature of 93.3 °C, which leads the core temperature to equilibrate at a fatal value of 42 °C. (dashed contours) Isopleths of wet-bulb temperature. (light green curve) The 125 °F isopleth of the National Weather Service's polynomial approximation to the heat index, which exhibits unphysical behavior and matches the "indoor light" points only by coincidence as discussed in the paper.