Romps, An analytical model for tropical relative humidity, J Climate, 2014
Paper
Description
Water vapor plays an important role in global warming. As fossil fuels are burned, the concentration of carbon dioxide (CO2) increases, which leads to warming. Warmer air "holds" more water vapor, so the concentration of water vapor increases. Water vapor is a powerful greenhouse gas, so an increase in its concentration leads to more warming, which allows the air to "hold" more water vapor, and so on. Fortunately, this is not a runaway process in the current climate (although it is expected to be at a sufficiently warm temperature). What this process does do, however, is amplify the direct warming caused by CO2.
An implicit assumption in this story is that the relative humidity (RH) of the atmosphere stays constant as the Earth warms. In global climate models, RH is found to remain roughly constant with warming, but no rigorous argument has been given as to why.
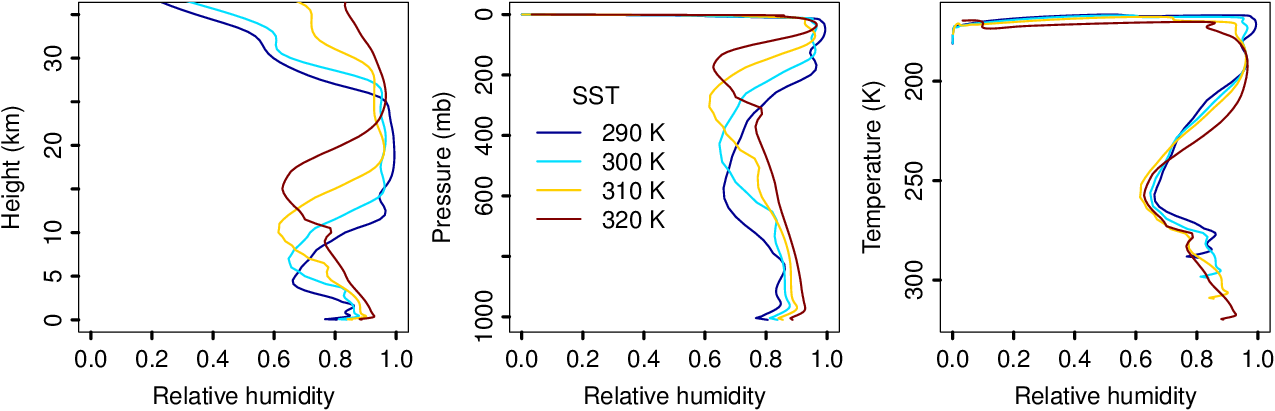
This paper addresses this gap by developing an analytical (i.e., pencil-and-paper) model for the relative humidity of the tropical atmosphere. Given a few inputs (the pressure, temperature, and the convective entrainment and detrainment rates), the equations predict the RH and the temperature lapse rate analytically. RH turns out to be a simple ratio involving the fractional detrainment rate and the water-vapor lapse rate. The theory explains the magnitude of RH and the "C" shape of the tropospheric RH profile. It also predicts that RH is an invariant function of temperature as the atmosphere warms, and this behavior matches what has been seen in global climate models and what is demonstrated here with cloud-resolving simulations. Extending the theory to include the evaporation of hydrometeors, a lower bound is derived for the precipitation efficiency (PE) at each height: PE > 1-RH. In a cloud-resolving simulation, this constraint is obeyed with the PE profile taking the shape of an inverted "C".
Profiles of relative humidity from 4 cloud-resolving simulations (sea-surface temperatures of 290, 300, 310, and 320 K) plotted in 3 ways (against height, pressure, and temperature). When plotted against temperature, the profiles collapse onto an invariant RH-T curve, as predicted by the theory.